

Functional group identification by FTIR is required for structural elucidation during drug development and during routine analysis test.
Functional Group Identification by FTIR Spectroscopy play a vital role for structural elucidation during drug development and for identification test during routine analysis..
Different chemical bonds of a molecule vibrate at characteristic frequencies, the resulting FTIR spectrum provides a useful “fingerprint” of the molecule. An FTIR spectrum is typically presented as a plot of transmittance or absorbance against wavenumber (cm⁻¹). The position, intensity, width, and shape of absorption bands provide important clues about the bonds and functional groups present in a sample.
The FTIR spectrum is generally divided into two important regions:
This region contains relatively distinct absorption bands associated with common functional groups. It is particularly useful for identifying bonds such as O–H, N–H, C–H, C≡N, C≡C, and C=O.
The fingerprint region contains many complex bending and stretching vibrations. Although individual peaks can be difficult to assign, the overall pattern is highly characteristic of a particular molecule. Comparing this region with a reference spectrum can therefore help confirm the identity of a compound.
A broad absorption band in this region generally indicates an O–H bond, commonly found in alcohols and phenols. The broad shape is often caused by hydrogen bonding between molecules.
N–H stretching vibrations usually appear as sharper bands than O–H absorptions. Primary amines often produce two N–H stretching bands, while secondary amines generally show one. Tertiary amines do not have an N–H bond and therefore do not show this absorption.
A sharp absorption slightly above 3000 cm⁻¹ commonly indicates sp² C–H stretching, associated with alkenes and aromatic compounds. A C–H stretch around this region can therefore provide evidence of unsaturation or an aromatic ring.
Sharp absorptions below 3000 cm⁻¹ are generally associated with sp³ C–H bonds, which are characteristic of saturated hydrocarbons such as alkanes.
Absorptions in this relatively narrow region may indicate the presence of a triple bond. Alkynes contain C≡C bonds, while nitriles contain C≡N bonds. The exact position and intensity of the band, together with other spectral features, help distinguish between these possibilities.
One of the most useful FTIR signals is the strong, sharp absorption produced by a carbonyl (C=O) group. Carbonyl-containing compounds include ketones, aldehydes, esters, carboxylic acids, and several other functional groups. The precise position of the absorption can vary depending on the surrounding molecular structure.
Absorptions in this region may be associated with C=C stretching in alkenes or with vibrations of aromatic rings. These peaks should be interpreted together with other evidence, such as C–H stretching above 3000 cm⁻¹ and characteristic bands in the fingerprint region.
Identifying a compound from FTIR should not depend on a single peak. Instead, the spectrum should be interpreted as a whole. First, look for strong and distinctive absorptions, such as a carbonyl peak. Next, examine the higher-wavenumber region for O–H, N–H, and C–H stretching vibrations. Finally, use the fingerprint region to compare the overall pattern with a known reference spectrum.
For example, a broad O–H band around 3300 cm⁻¹, combined with strong C–O absorptions in the fingerprint region and the absence of a carbonyl peak, could suggest an alcohol. In contrast, a strong absorption near 1700 cm⁻¹ together with appropriate C–H bands would point toward a carbonyl-containing compound.
Figure – 1 contains several groups like -OH, -COOH, -NH2, -CN , -CO with their position in FTIR spectrum.
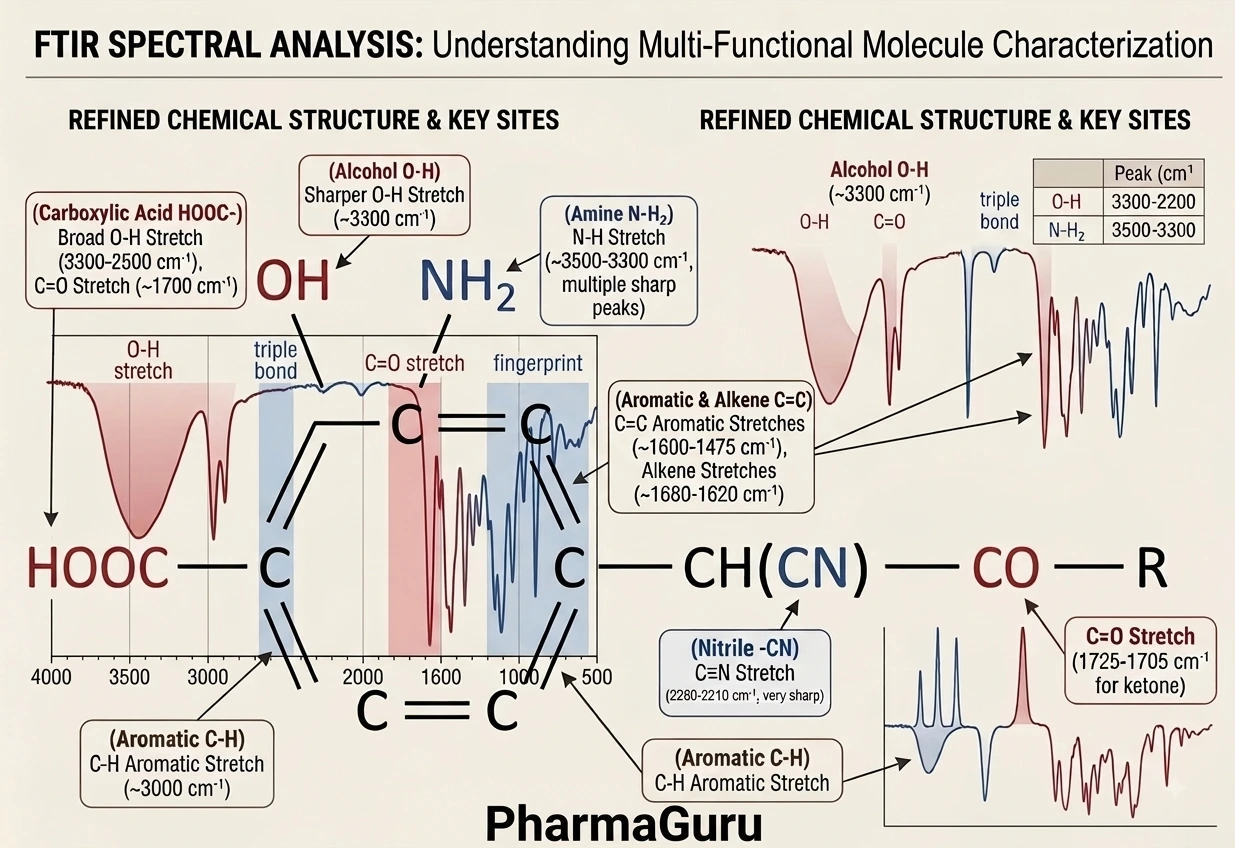
FTIR spectroscopy provides a quick and effective way to investigate the structure of chemical compounds. By carefully examining peak position, intensity, shape, and the overall fingerprint pattern, researchers can identify important functional groups and compare unknown substances with reference compounds. Although individual absorption bands provide valuable clues, reliable identification comes from considering the complete FTIR spectrum rather than relying on a single peak.
Related:
Further Reading:
Quick Links