Dr Pramod Kumar Pandey, PhD in Chemistry, is a Analytical expert with 31+ years of experience in pharmaceutical development and the founder of PharmaGuru.co, a global platform for pharmaceutical training and industry insights
Here you will learn particle size analysis definition, principles, D10, D50, and D90, purpose, applications and factors affecting the Measurement with FAQS
Particle Size Analysis Key Terms: Get Mastery In 9 Minutes With 21+FAQs
Particle size analysis is a set of laboratory techniques to determine the size range and average size of particles in a sample, such as a powder or liquid. Common methods include sieving, sedimentation, laser diffraction, and microscopy.
1. What is Particle Analysis?
Particle size analysis is the process of determining the size and distribution of particles within a sample, such as a powder, suspension, or emulsion, by measuring the dimensions of individual particles to evaluate their characteristics and behaviour. This analysis plays a vital role in fields such as pharmaceuticals, materials science, and environmental monitoring, where particle size has a direct influence on product performance and process efficiency. Common techniques used include sieving, laser diffraction, and dynamic image analysis.
Key Aspects of Particle Analysis:
Particle Size: The measurement of the dimensions of individual particles is often expressed as an equivalent spherical diameter (since most particles are irregularly shaped).
Particle Size Distribution (PSD): The range and proportion of different particle sizes within a sample, typically presented as a percentage finer (passing) versus particle size.
Particle Shape and Morphology: Describes the form, roundness, or aspect ratio of particles, which affects flowability, packing, and surface area.
Particle Count and Concentration: The total number of particles present in a given mass, volume, or area.
Other Properties (Optional):
Surface area
Porosity
Density
Agglomeration behavior
Purpose and Applications of Particle Analysis:
Particle analysis is used in a wide range of industries and scientific fields because particle characteristics strongly influence product performance and process efficiency.
Common Applications:
Industry
Purpose of Particle Analysis
Pharmaceuticals
To control drug dissolution rate, bioavailability, and uniformity.
Cement & Concrete
To ensure proper gradation and strength of materials.
Sieve Analysis – mechanical separation for coarse particles (>75 µm).
Laser Diffraction – optical scattering for fine particles (0.1–3000 µm).
Dynamic Light Scattering (DLS) – for nanoparticles (1 nm–1 µm).
Microscopy (Optical or Electron) – direct visualisation and size measurement.
Sedimentation Techniques – based on particle settling rate.
Coulter Counter (Electrical Sensing Zone) – counts and sizes particles suspended in a conductive fluid.
2. What is the Basic Principle of Particle Size Analysis?
Principle:
The basic principle of particle size analysis is to determine the size or size distribution of particles by measuring how they interact with physical forces or fields such as light, gravity, or electrical signals. Different analytical techniques apply different physical principles to obtain size-related data.
Common Underlying Principles Used in Particle Size Analysis:
1. Mechanical Sieving (Separation by Size)
Principle: Particles are separated based on their ability to pass through a series of sieves with progressively smaller openings.
Applicable Range: Typically for particles larger than 75 µm.
Basis: Larger particles are retained on coarser sieves, while finer particles pass through.
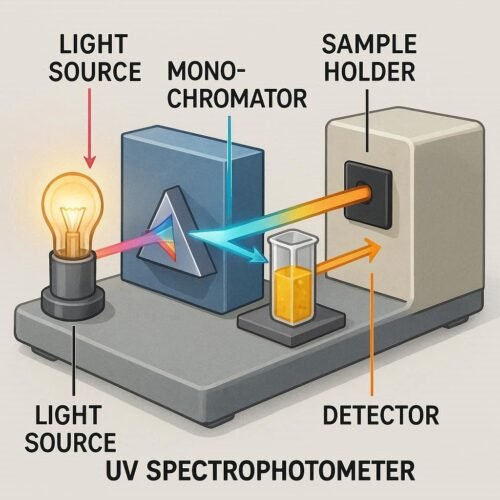
2. Light Scattering (Laser Diffraction or Dynamic Light Scattering)
Principle: When a laser beam passes through a dispersed particle sample, the light is scattered at different angles depending on particle size.
Large particles scatter light at small angles.
Small particles scatter light at large angles.
Analysis: The scattering pattern is mathematically analysed (using Mie or Fraunhofer theory) to determine the size distribution.
Applicable Range: From nanometers to millimetres (depending on the instrument).
3. Sedimentation (Gravitational or Centrifugal)
Principle: Particles suspended in a fluid settle at rates dependent on their size, shape, and density (according to Stokes’ Law).
Measurement: The sedimentation rate or time required to reach a certain depth helps calculate the equivalent particle diameter.
4. Electrical Sensing Zone (Coulter Principle)
Principle: Particles suspended in an electrolyte pass through a small orifice with an electrical current. Each particle displaces its own volume of conducting fluid, momentarily changing the resistance.
The magnitude of the resistance change is proportional to the particle’s volume (hence, its size).
5. Microscopy and Image Analysis
Principle: Direct visual observation and measurement of individual particles using an optical or electron microscope. Image analysis software can automatically calculate diameter, area, perimeter, and shape parameters.
General Concept Behind All Particle Size Analysis Techniques:
No matter the method used, all particle size analyses share a common goal:
To measure a particle’s characteristic dimension by relating a measurable physical response (light scattering, mass, resistance, or sedimentation rate) to an equivalent particle diameter.
Factors Affecting the Measurement:
Particle Shape and Agglomeration
Sample Dispersion and Preparation
Measurement Medium (air, water, solvent)
Instrument Calibration
Refractive Index (for optical methods)
Summary:
Aspect
Description
Definition
Particle analysis is the process of determining the size, shape, and distribution of particles in a material.
Purpose
Sieving, laser diffraction, DLS, microscopy, sedimentation, and Coulter counter.
Principle
Based on how particles interact with physical forces such as light, gravity, or electrical signals, from which size is inferred.
Common Techniques
Based on how particles interact with physical forces such as light, gravity, or electrical signals, which size is inferred.
3. What are three terms associated with particle size?
Three Terms Associated with Particle Size:
Mean Particle Size (Average Size): The arithmetic or weighted average diameter of particles in a sample.
Particle Size Distribution (PSD): Describes how the sizes of particles are distributed within a sample, typically represented as a cumulative percentage versus particle size.
Equivalent Diameter: Since most particles are not perfect spheres, an equivalent diameter is used — the diameter of a sphere that behaves the same way (e.g., in sedimentation or light scattering).
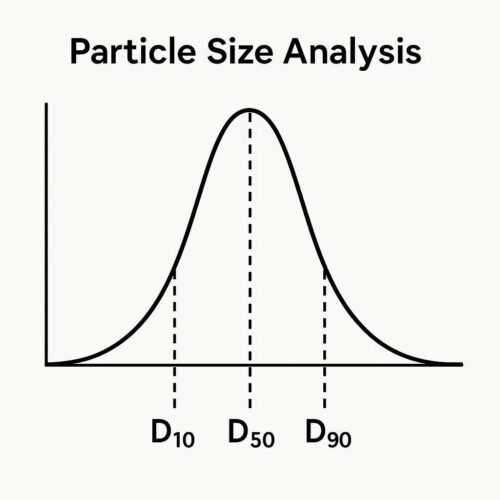
4. What Are D10, D50, and D90 in Particle Size?
Particle Size Analysis Key Terms: Get Mastery In 9 Minutes With 21+FAQs 4
D10 (Effective Size): The particle diameter below which 10% of the sample’s mass (or volume) exists. → It represents the finer end of the distribution.
D50 (Median Particle Size): The particle diameter at which 50% of the particles (by volume or mass) are smaller and 50% are larger. → Indicates the central tendency of the particle size distribution.
D90: The particle diameter below which 90% of the particles exist. → Represents the coarser portion of the sample.
5. How to Calculate D10, D50, D90 in Excel?
Prepare data:
Column A: Particle Size (µm)
Column B: % Passing or % Finer (cumulative)
Use Interpolation:
Find where the cumulative % passes 10%, 50%, and 90%. Use linear interpolation between the two nearest points.
Formula:
Particle Size Analysis Key Terms: Get Mastery In 9 Minutes With 21+FAQs 5
14. How to Generate a Particle Size Distribution Curve
Perform sieve or instrument analysis.
Compute % retained and cumulative % passing.
Plot % passing (Y-axis) vs. particle size (X-axis, log scale).
15. What Information Does a PSD Curve Provide?
Range of particle sizes
Uniformity and gradation
Dominant particle size (median)
Proportion of fine vs. coarse material
Comparative data between samples
16. What Common Mistakes Are Made When Generating a Particle Size Distribution Curve?
Common Mistakes When Generating a PSD Curve:
Not using a logarithmic scale for particle size
Incorrect cumulative percentage calculation
Ignoring mass balance errors
Mislabeling axes or data units
Failing to account for outliers or agglomeration
17. What are common problems, and what do they mean?
Problem
Possible Cause
Irregular curve
Incomplete sieving or instrument error
Shifts in the curve
Over-grinding or dust contamination
Shifts in curve
Process inconsistency
Multiple peaks
Agglomeration or mixed material sources
18. What is the Importance of Particle Size Distribution?
Determines performance in concrete, paints, pharmaceuticals, etc.
Influences porosity, strength, reactivity, and stability.
Critical for quality control and specification compliance.
19. What is the best way to measure particle size with a simple optical microscope?
Best Way to Measure Particle Size with a Simple Optical Microscope
Use a calibrated eyepiece graticule or digital image software.
Capture images under known magnification.
Measure several particles and calculate the average diameter.
Suitable for particles >1 µm in size.
21. What is the simplest method for determining the number of particles in a given volume (mL)?
Simplest Method for Determining the Number of Particles in a Given Volume (mL)
Direct Microscopic Counting:
Use a counting chamber (hemocytometer) or microscope slide grid.
Count the number of particles in a known grid volume.
Calculate the number per mL using:
Particles/mL} = (N x D)/V
Where: ( N ) = particles counted, ( D ) = dilution factor, ( V ) = volume observed.
Expert Tips: Particle size analysis provides essential data on material characteristics, helping control product quality and process efficiency. Different techniques and representations reveal complementary information about the size, distribution, and behaviour of particles.