GC and HPLC peaks are graphical representations of compounds eluting from a chromatography system, where the x-axis denotes retention time, and the peak height or area corresponds to the compound’s concentration, providing both qualitative and quantitative information about the sample. Chromatography (both Gas Chromatography – GC and High-Performance Liquid Chromatography – HPLC) relies on the […]

GC and HPLC peaks are graphical representations of compounds eluting from a chromatography system, where the x-axis denotes retention time, and the peak height or area corresponds to the compound’s concentration, providing both qualitative and quantitative information about the sample.
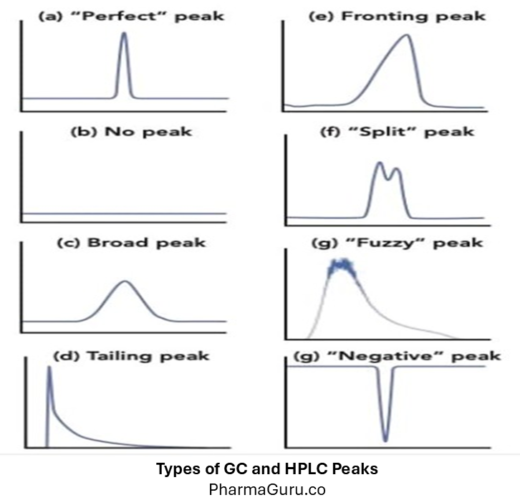
Chromatography (both Gas Chromatography – GC and High-Performance Liquid Chromatography – HPLC) relies on the separation of analytes based on their interaction with the stationary and mobile phases. A perfect chromatographic peak should be symmetrical, sharp, and well-resolved.
However, due to instrumental, column, or sample issues, peaks may deviate from their ideal shape. Understanding these peak types helps in identifying the root cause and optimising the system for better performance.

A perfect peak (or Gaussian peak) is symmetrical with a uniform rise and fall, representing ideal chromatography where the analyte interacts consistently with the stationary phase.
Causes of perfect peak:
Also called a leading peak, fronting occurs when the front of the peak slopes forward, appearing skewed to the left.
Common causes:
A tailing peak is asymmetrical with a long trailing edge, skewed to the right. It is one of the most common problems in HPLC/GC.
Common causes:
A fuzzy or noisy peak lacks a well-defined shape and may have a “hairy” or irregular appearance.
Common causes:
A broad peak is wide and poorly defined, often overlapping with adjacent peaks, reducing resolution.
Common causes:
Sometimes, no peak appears even when the analyte injection is performed correctly.
Common causes:
A negative peak appears below the baseline and is typically seen in refractive index (RI) or UV detectors under certain conditions.
Common causes:
| Peak Type | Peak Shape / Appearance | Probable Cause | Corrective Actions |
|---|---|---|---|
| Perfect Peak | Symmetrical, Gaussian shape | Ideal system performance | Maintain system, consistent method and column care |
| Fronting Peak | Peak leans forward (left) | Column overload, inlet damage, active sites | Reduce sample concentration, clean or replace inlet/column |
| Tailing Peak | Peak drags backward (right) | Column contamination, silanol activity, pH mismatch | Use end-capped columns, optimize pH, and flush the column |
| Fuzzy Peak | Irregular, noisy, “hairy” | Detector noise, bubbles, unstable baseline | Degas solvents, check detector electronics |
| Broad Peak | Wide, flat-topped peak | Column voids, poor focusing, long residence time | Replace column, optimize flow rate or temperature |
| No Peak | Baseline only, no analyte signal | Detector fault, wrong settings, no analyte | Check detector, sample prep, and injection system |
| Negative Peak | Peak dips below baseline | Solvent mismatch, refractive index shift | Match solvent with mobile phase, eliminate bubbles |
Recognising chromatographic peak shapes is a key analytical skill in both GC and HPLC. Each abnormal peak shape signals a specific issue — whether in the sample, system, or column.
Maintaining system cleanliness, using proper mobile phases, and adhering to validated operating conditions can significantly reduce these peak distortions and improve analytical precision.
Here are detailed answers to your questions about peaks in Gas Chromatography (GC) and High‑Performance Liquid Chromatography (HPLC) — covering types, meaning, causes, formulas and troubleshooting.
Boost your pharma career with PharmaGuru’s expert-led online courses.: Online Pharma Course (Training)
Here are several common peak types:
Similarities:
Differences:
A peak in HPLC corresponds to a compound (or sometimes more than one) that elutes from the column and is detected. The retention time points to identity (by comparing to standards), the peak area (or height) corresponds to the quantity of that compound in the sample, and the peak shape gives clues about separation quality and system performance.
In HPLC, a peak is a rise above the baseline in a chromatogram representing the elution (exit) of an analyte from the column and its detection by the detector. The time when the peak appears is the retention time; the magnitude (area or height) gives the amount, and the shape (symmetry, width) gives information about the quality of separation and system performance.
The peak area is the integral of the signal (detector response) over the time interval of the peak. It is commonly used for quantification because it accounts for both height and width of the peak. The concentration of the analyte is often calculated by comparing its peak area to that of a standard under the same conditions.
A system peak (sometimes called a ghost peak, blank peak or pseudo-peak) is a peak that appears even when only mobile phase (or a blank) is injected — meaning it doesn’t arise from the analyte but from components of the system (mobile phase impurities, column bleed, solvent mismatch, carry-over). These must be identified and excluded from analysis.
Dead volume (or unswept volume) in the system refers to parts of the flow path where mobile phase/solute mixture is stagnant or poorly flushed, causing broadening and distortion of peaks. A “dead volume peak” could be a broadened signal or tailing due to extra column volume and slow transport of analyte. In GC, unswept volume often causes tailing or broad peaks.
Some common peak problems include:
A negative peak occurs when the detector response for the injected sample is lower than that of the mobile phase baseline (or when the sample solvent has higher refractive index/absorbance than mobile phase in detectors like RI). It may be caused by solvent mismatch, injection of stronger solvent than mobile phase, detector settings, or a disturbed baseline. For example, the sample solvent may absorb less at the detector wavelength or cause a drop in detector response.
A shoulder peak presents as a bump or “shoulder” on the side of the main peak rather than a fully separate peak. This indicates partial separation of two analytes (co-elution but close retention), or a compound interacting in two forms (e.g., isomers or conformers) or a column/packing issue. This shape complicates the integration and quantification of the analyte.
The peak area is calculated as the integral of the detector response curve over time for the peak. In practice many chromatography systems calculate it via automated integration. One common metric related to peak shape is the tailing factor (T) in HPLC:
In GC, a peak corresponds to a compound that elutes from the column at a particular retention time. From a peak you can derive:
A GC peak is the signal response produced when an analyte emerges from the GC column, is detected and plotted as a rise above baseline in the chromatogram. The x-axis is retention time; the position of the peak indicates when the analyte eluted; the area or height reflects the amount of analyte.
Often in GC, the first peak (earliest retention time) may correspond to the most volatile component, or even the solvent or carrier gas artefact. In practice, the first peak may not be a true analyte of interest but could be an unretained compound or solvent front.
“Better” is subjective — GC peaks may often be sharper and narrower (for volatile compounds) due to lower dispersion and faster kinetics of gas phase analysis, which can improve resolution for volatile analytes. GC also often has a simpler mobile phase (carrier gas) and less extra-column volume. However, HPLC is more versatile (for non-volatile, polar, thermally labile compounds). So GC peaks may appear “better” for specific applications, but it’s not a universal truth.
In GC, peak tailing can be caused by:
In both GC and HPLC a “peak” is the visual representation in the chromatogram of a component eluting from the column and being detected. It carries meaning about which compound (via retention time), how much (via area/height), and how well separated/quantified (via shape).
Steps to identify peaks:
Related:
Further reading:
Quick Links